SAR Analysis Tool
Conversational AI for defense analysts, built to earn trust before it answers. Every answer cites the source PDF it came from.
- Role
- UX Design Lead
- Organization
- Tecolote Research
- Timeline
- June 2026 · 5-day sprint
- Team
- Gabrielle Bly — Front end, CSS, formatting resultsKate Borgen — Design wireframes and prototype, system design, AI knowledge supportAndrew Josten — AI chatlog maintenance, main prompt construction, test data, AI queries and app developmentRin Pham — JavaScript development and AI querying tasksJose Valladares — Perch connection, PDF to JSON conversion, JSON data transmission to Perch
- Status
- Prototyped, concept approved
Defense acquisition programs publish cost, schedule, and performance data in Selected Acquisition Reports — trapped in static PDFs. Analysts dug through hundreds of them by hand, one document at a time, so seeing patterns across programs was close to impossible.
The problem
Hundreds of PDFs. No shared view across programs. Spotting a trend means reading every report by hand.
"What should take hours of analysis stretches into weeks of manual work. Critical patterns remain invisible."
Discovery
I ran semi-structured interviews with cost analysts across several programs. Three findings shaped the build:
- Search patterns are predictable. Analysts look for the same things — cost growth, schedule slippage, milestone comparisons. They need cross-program views, not document-by-document reading.
- The bottleneck is access, not skill. These are expert users. The time sink is locating and extracting data before analysis even starts.
- Trust requires traceability. Every data point needs a source. Analysts won't adopt a tool that answers without showing where the answer came from.
Results and impact
Two distinct achievements from this work — kept separate, never combined into one stat:
- Reduced analysis time by 30% by simplifying the multi-step workflows DoD cost analysts run across data ingestion, validation, and reporting (the workflow redesign).
- Delivered to 90% user acceptance in showcase feedback from DoD acquisition analysts — the conversational AI analysis tool designed in the 5-day sprint (the AI tool).
By the Day 5 showcase, the tool did what we set out to prove: upload a SAR, ask a question, get a sourced answer in seconds. A cross-year schedule comparison that would normally take hours of manual PDF review ran end to end in minutes on stage. The demo held on Perch (an internal Claude Sonnet wrapper) with a local Ollama fallback standing by — nothing fell over.
The project validated conversational query with structured prompting for defense acquisition data. Analysts in this domain are trained to distrust ungrounded AI output by default. The tool earned trust anyway.
A 5-day sprint left no room to close the loop with usage data. If the tool moved past the demo, the next build would track time-to-answer and how often analysts clicked through to the source document instead of trusting the summary outright. The Quick Glance panel gave analysts something to check the AI against before they read its answer. That's also where the next build's metrics would start.
Same data, three filings apart
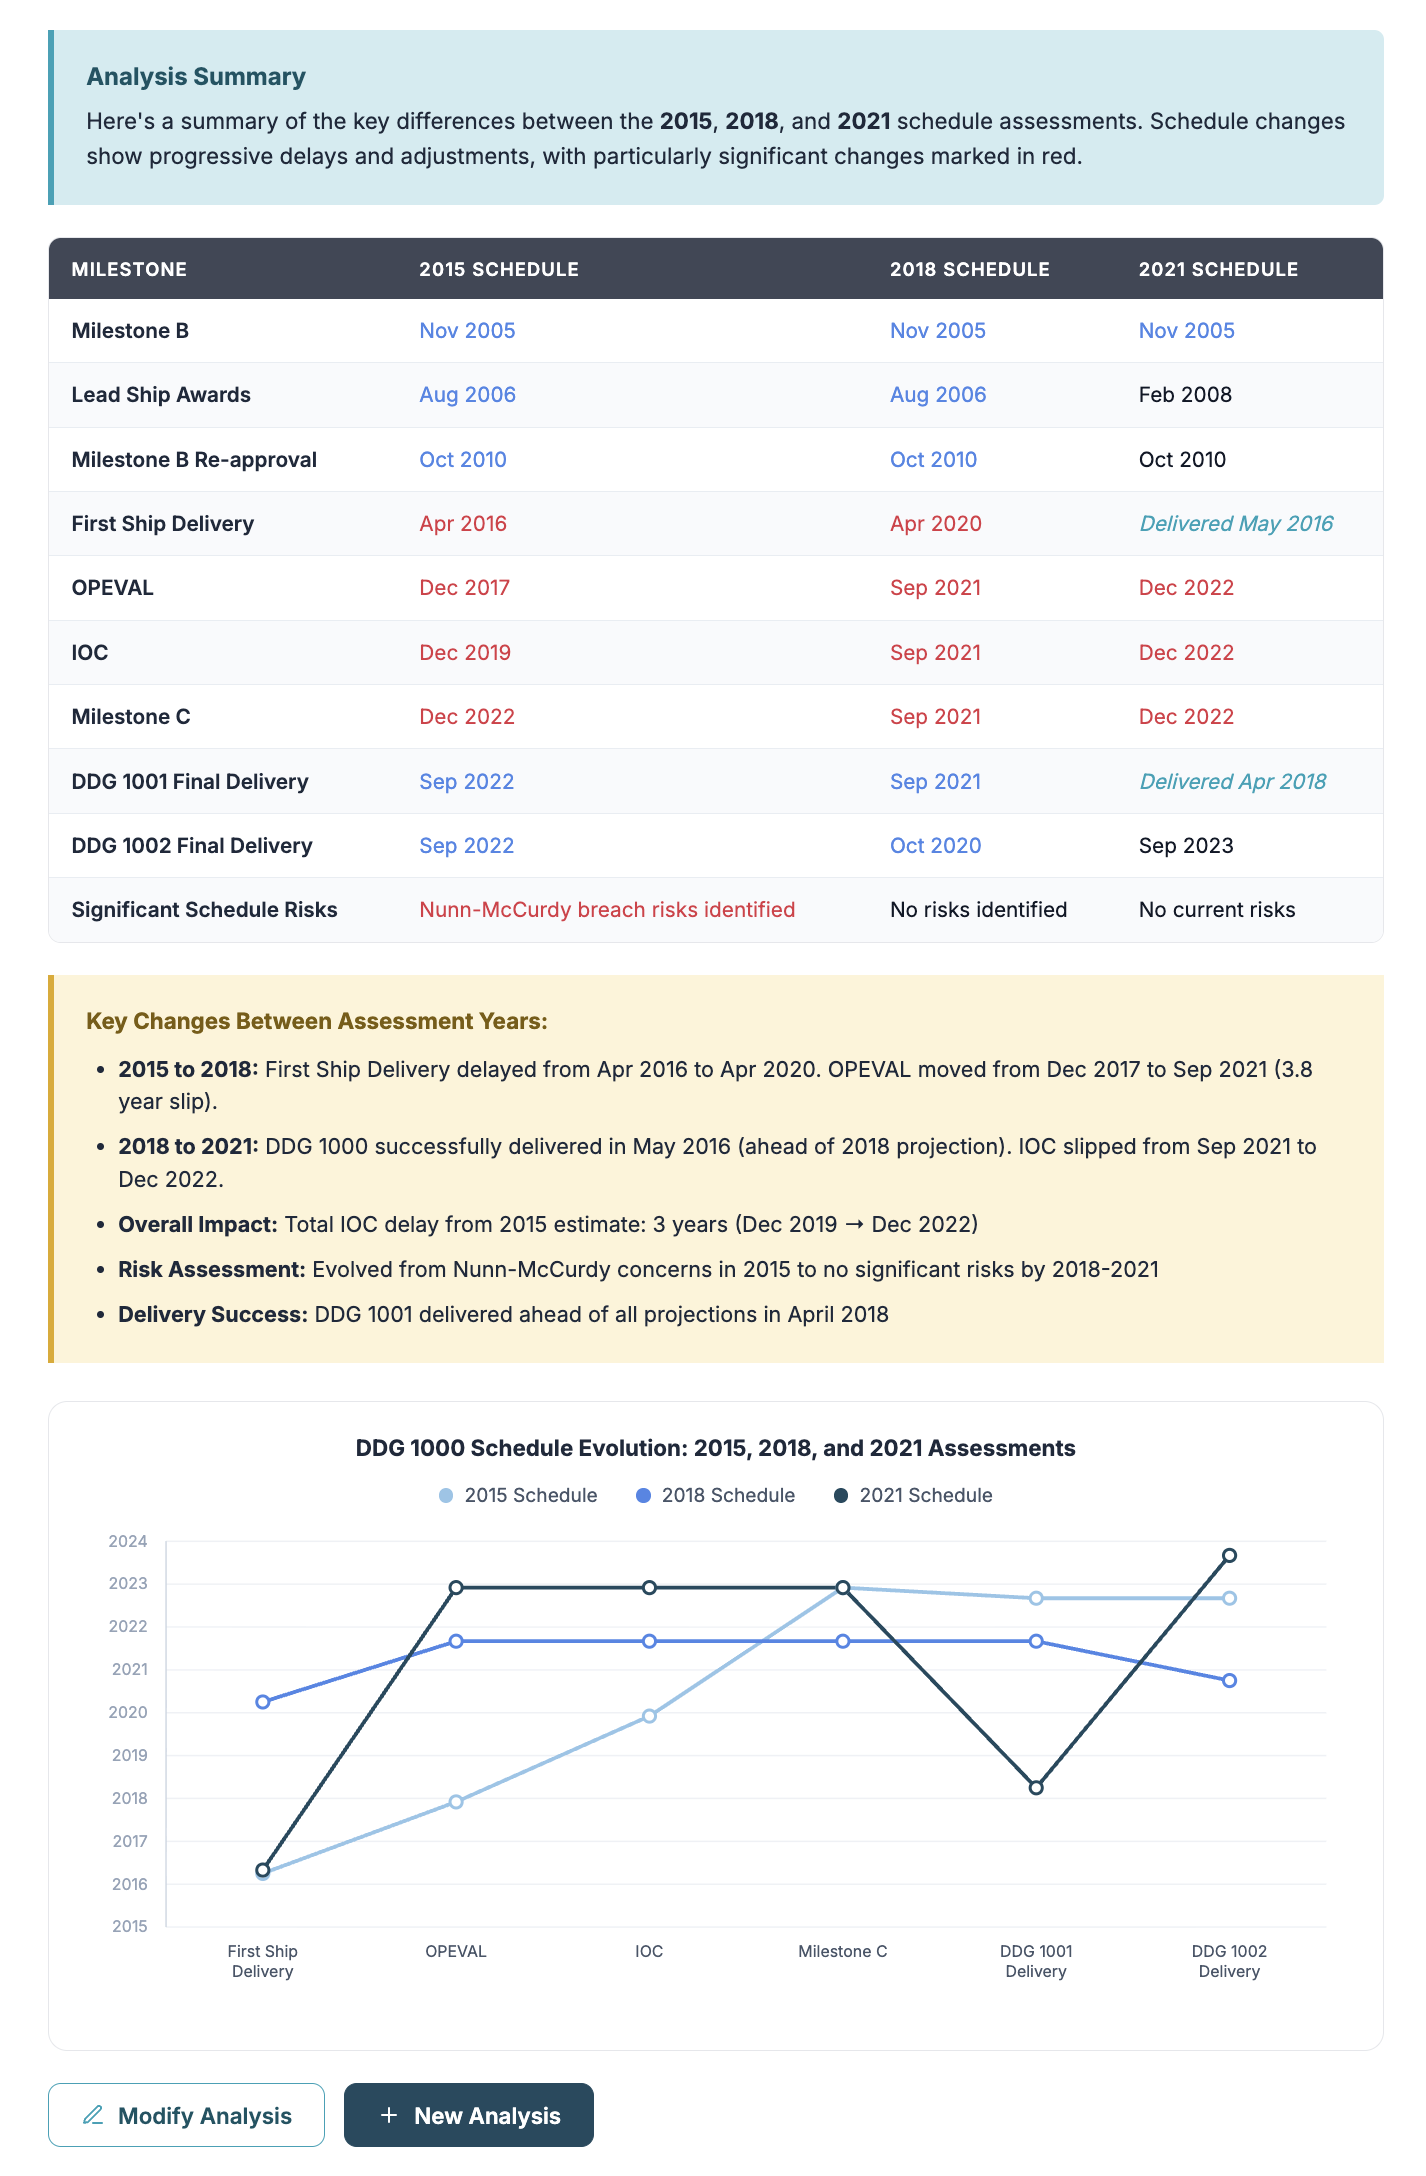
Three DDG 1000 schedule pages, filed six years apart. Answering "how far has IOC moved?" means opening three PDFs, finding the schedule section in each, and diffing the columns by eye.
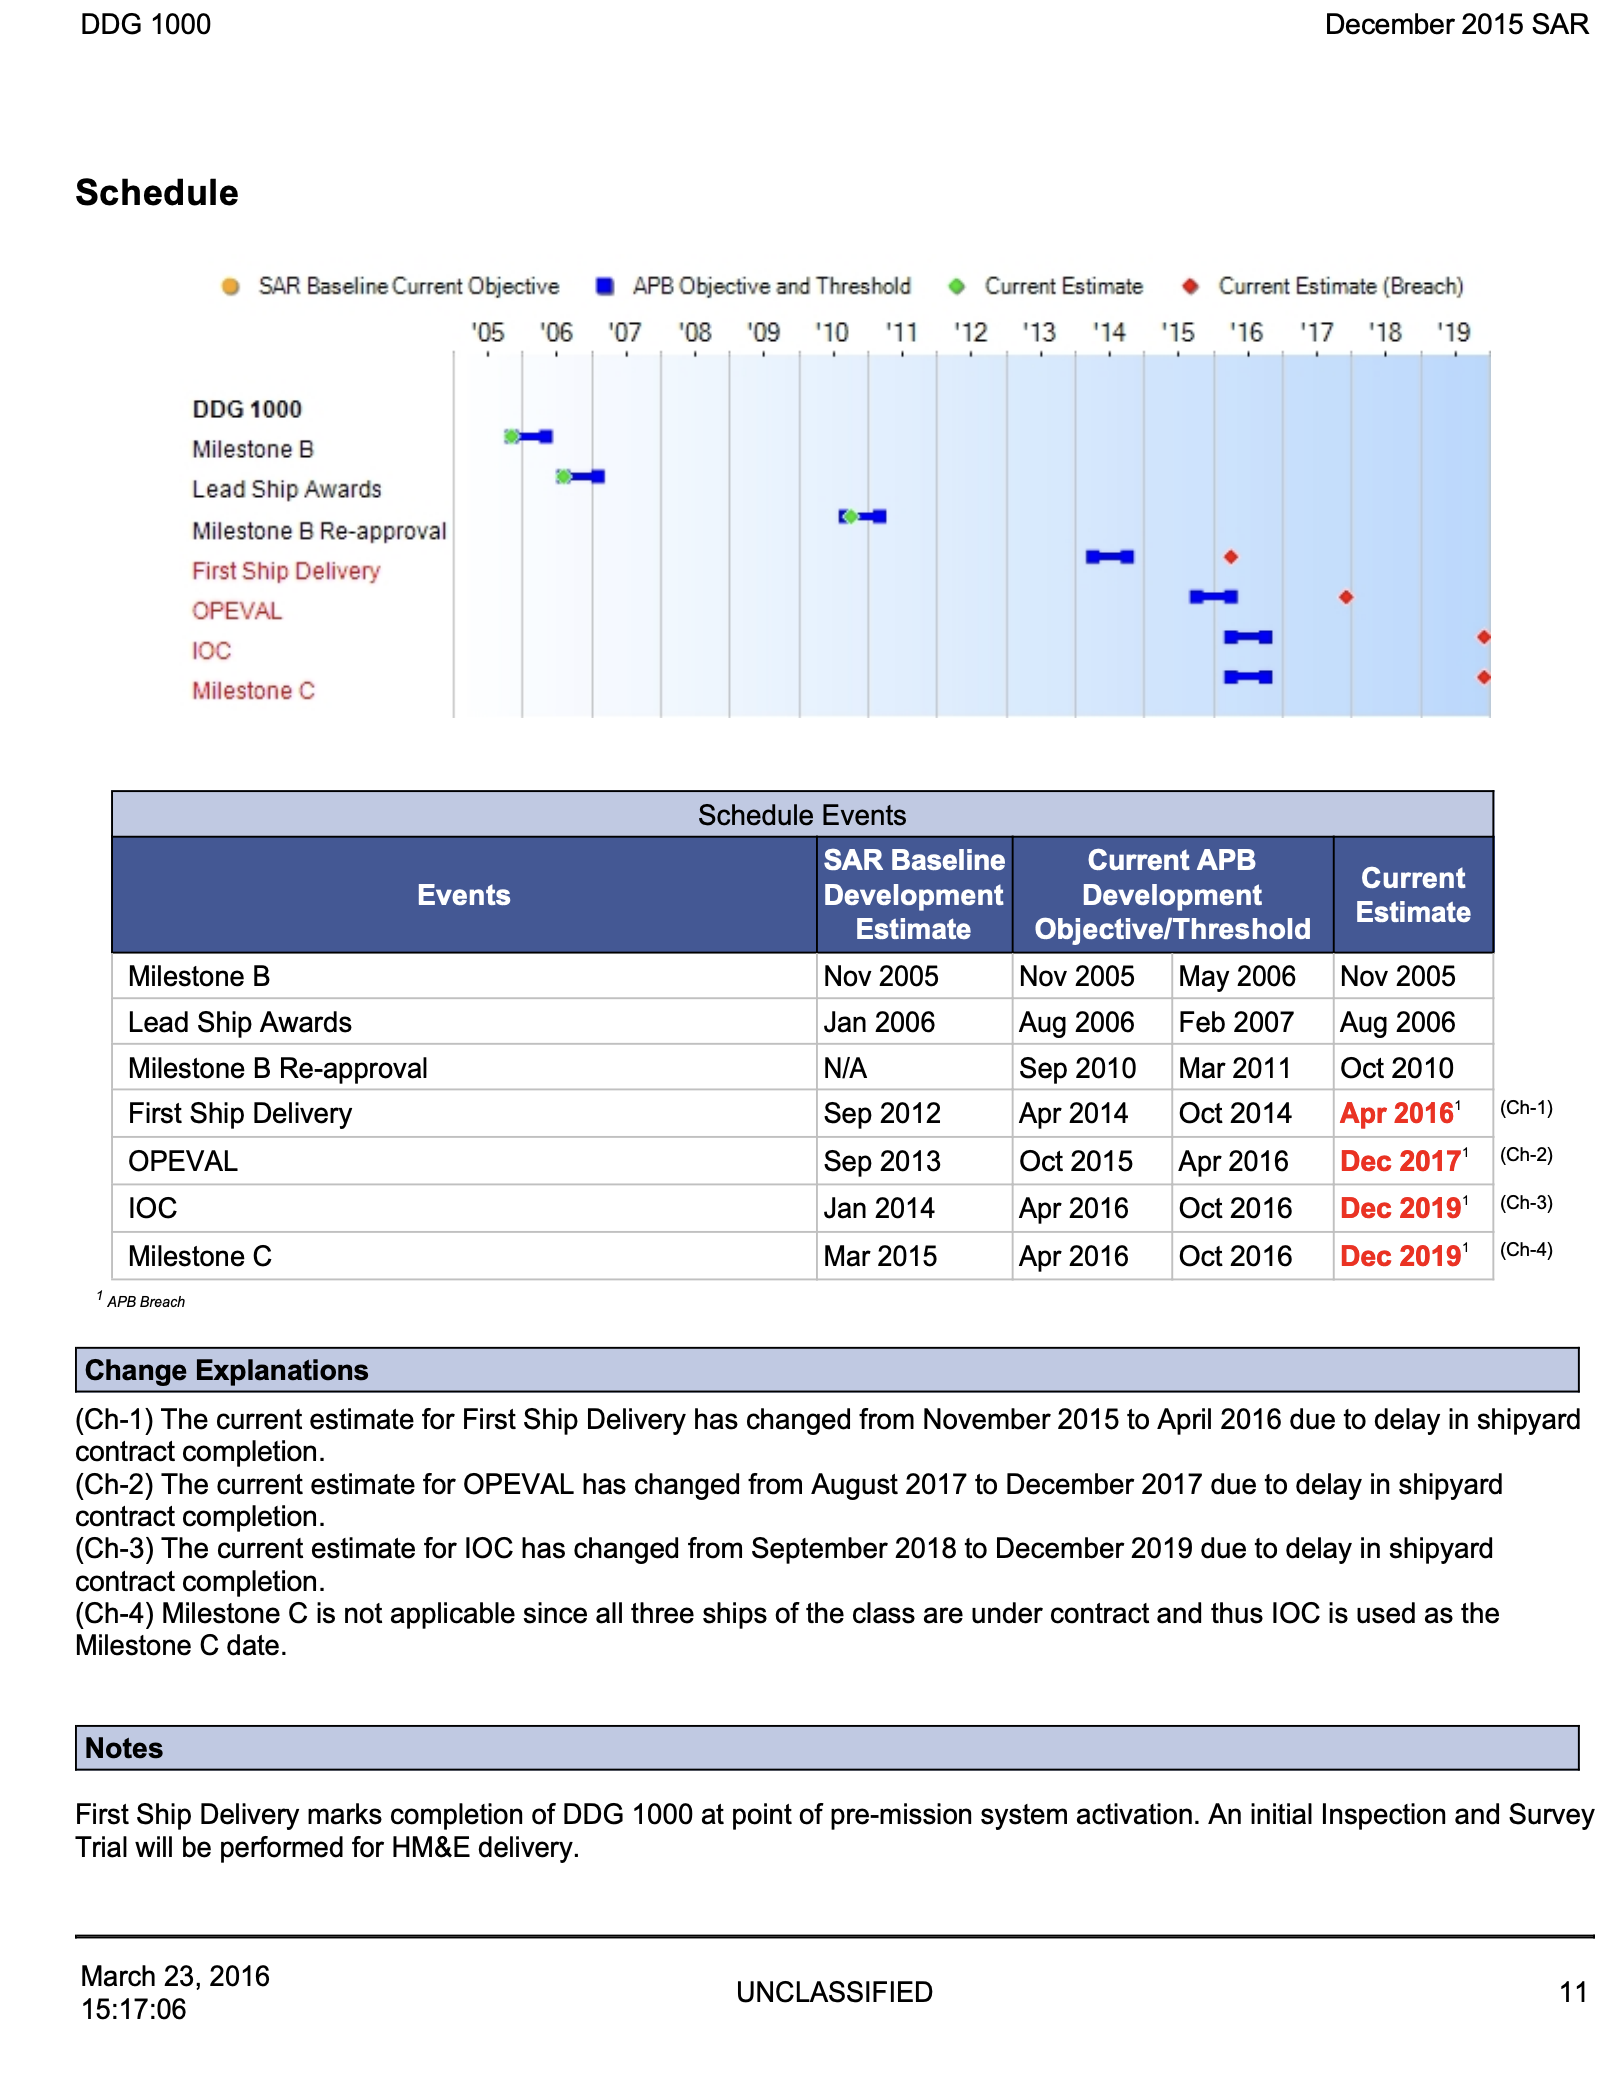
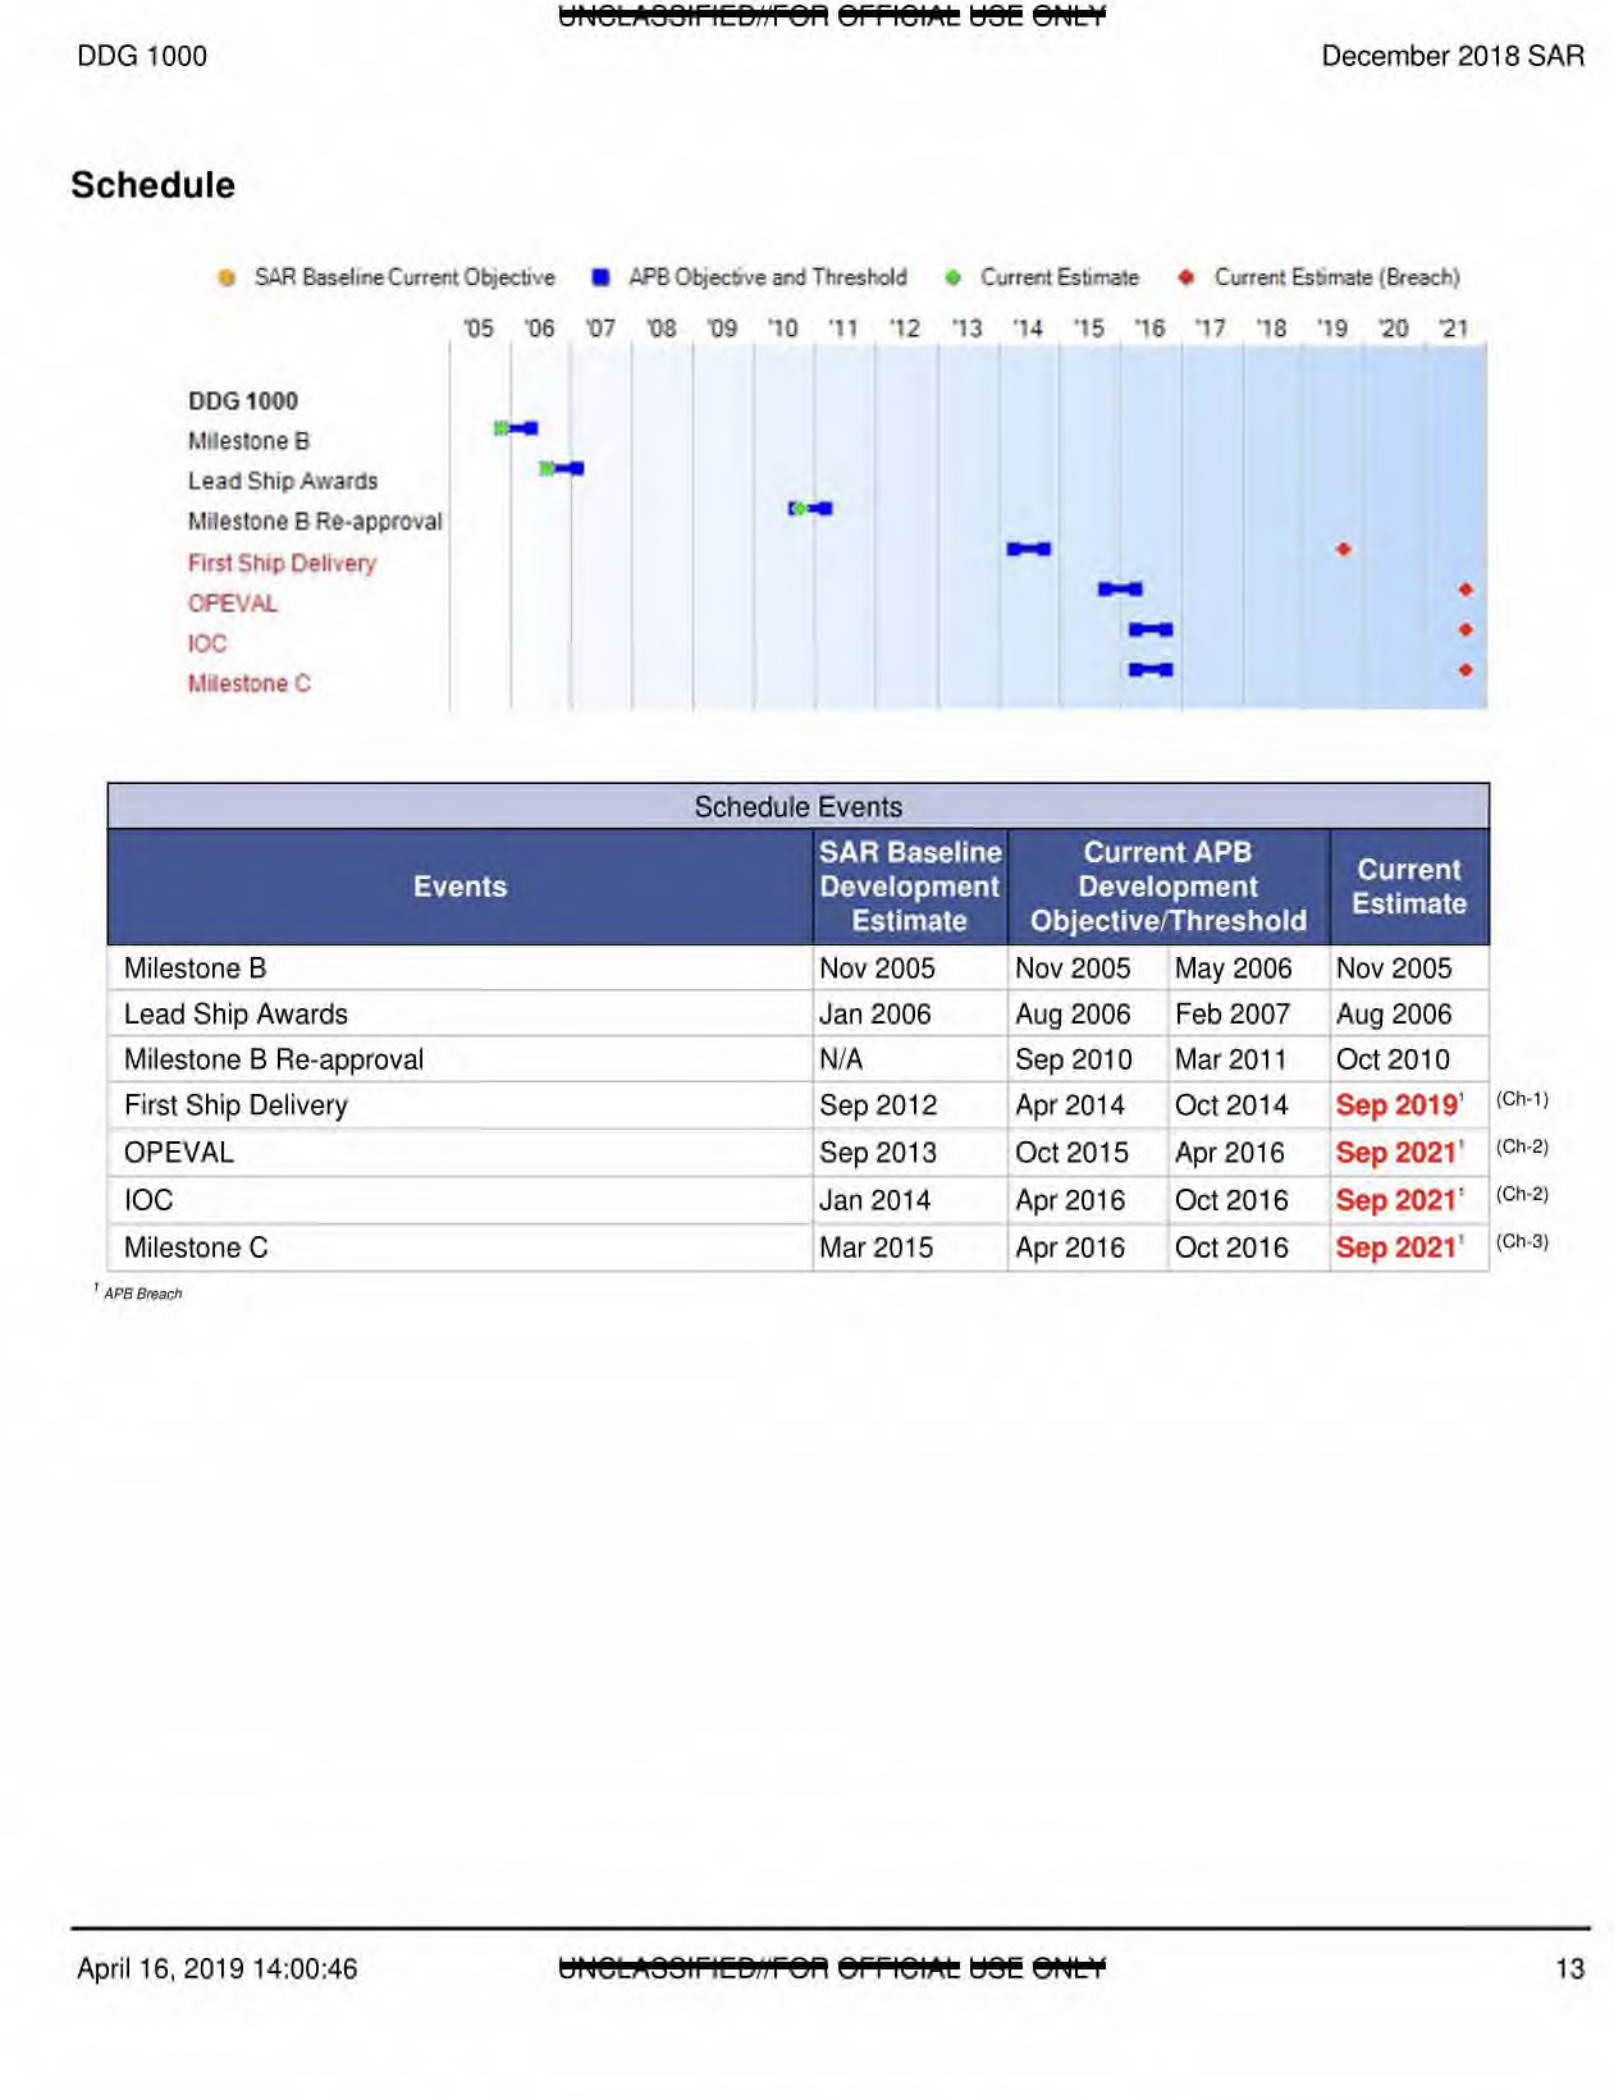
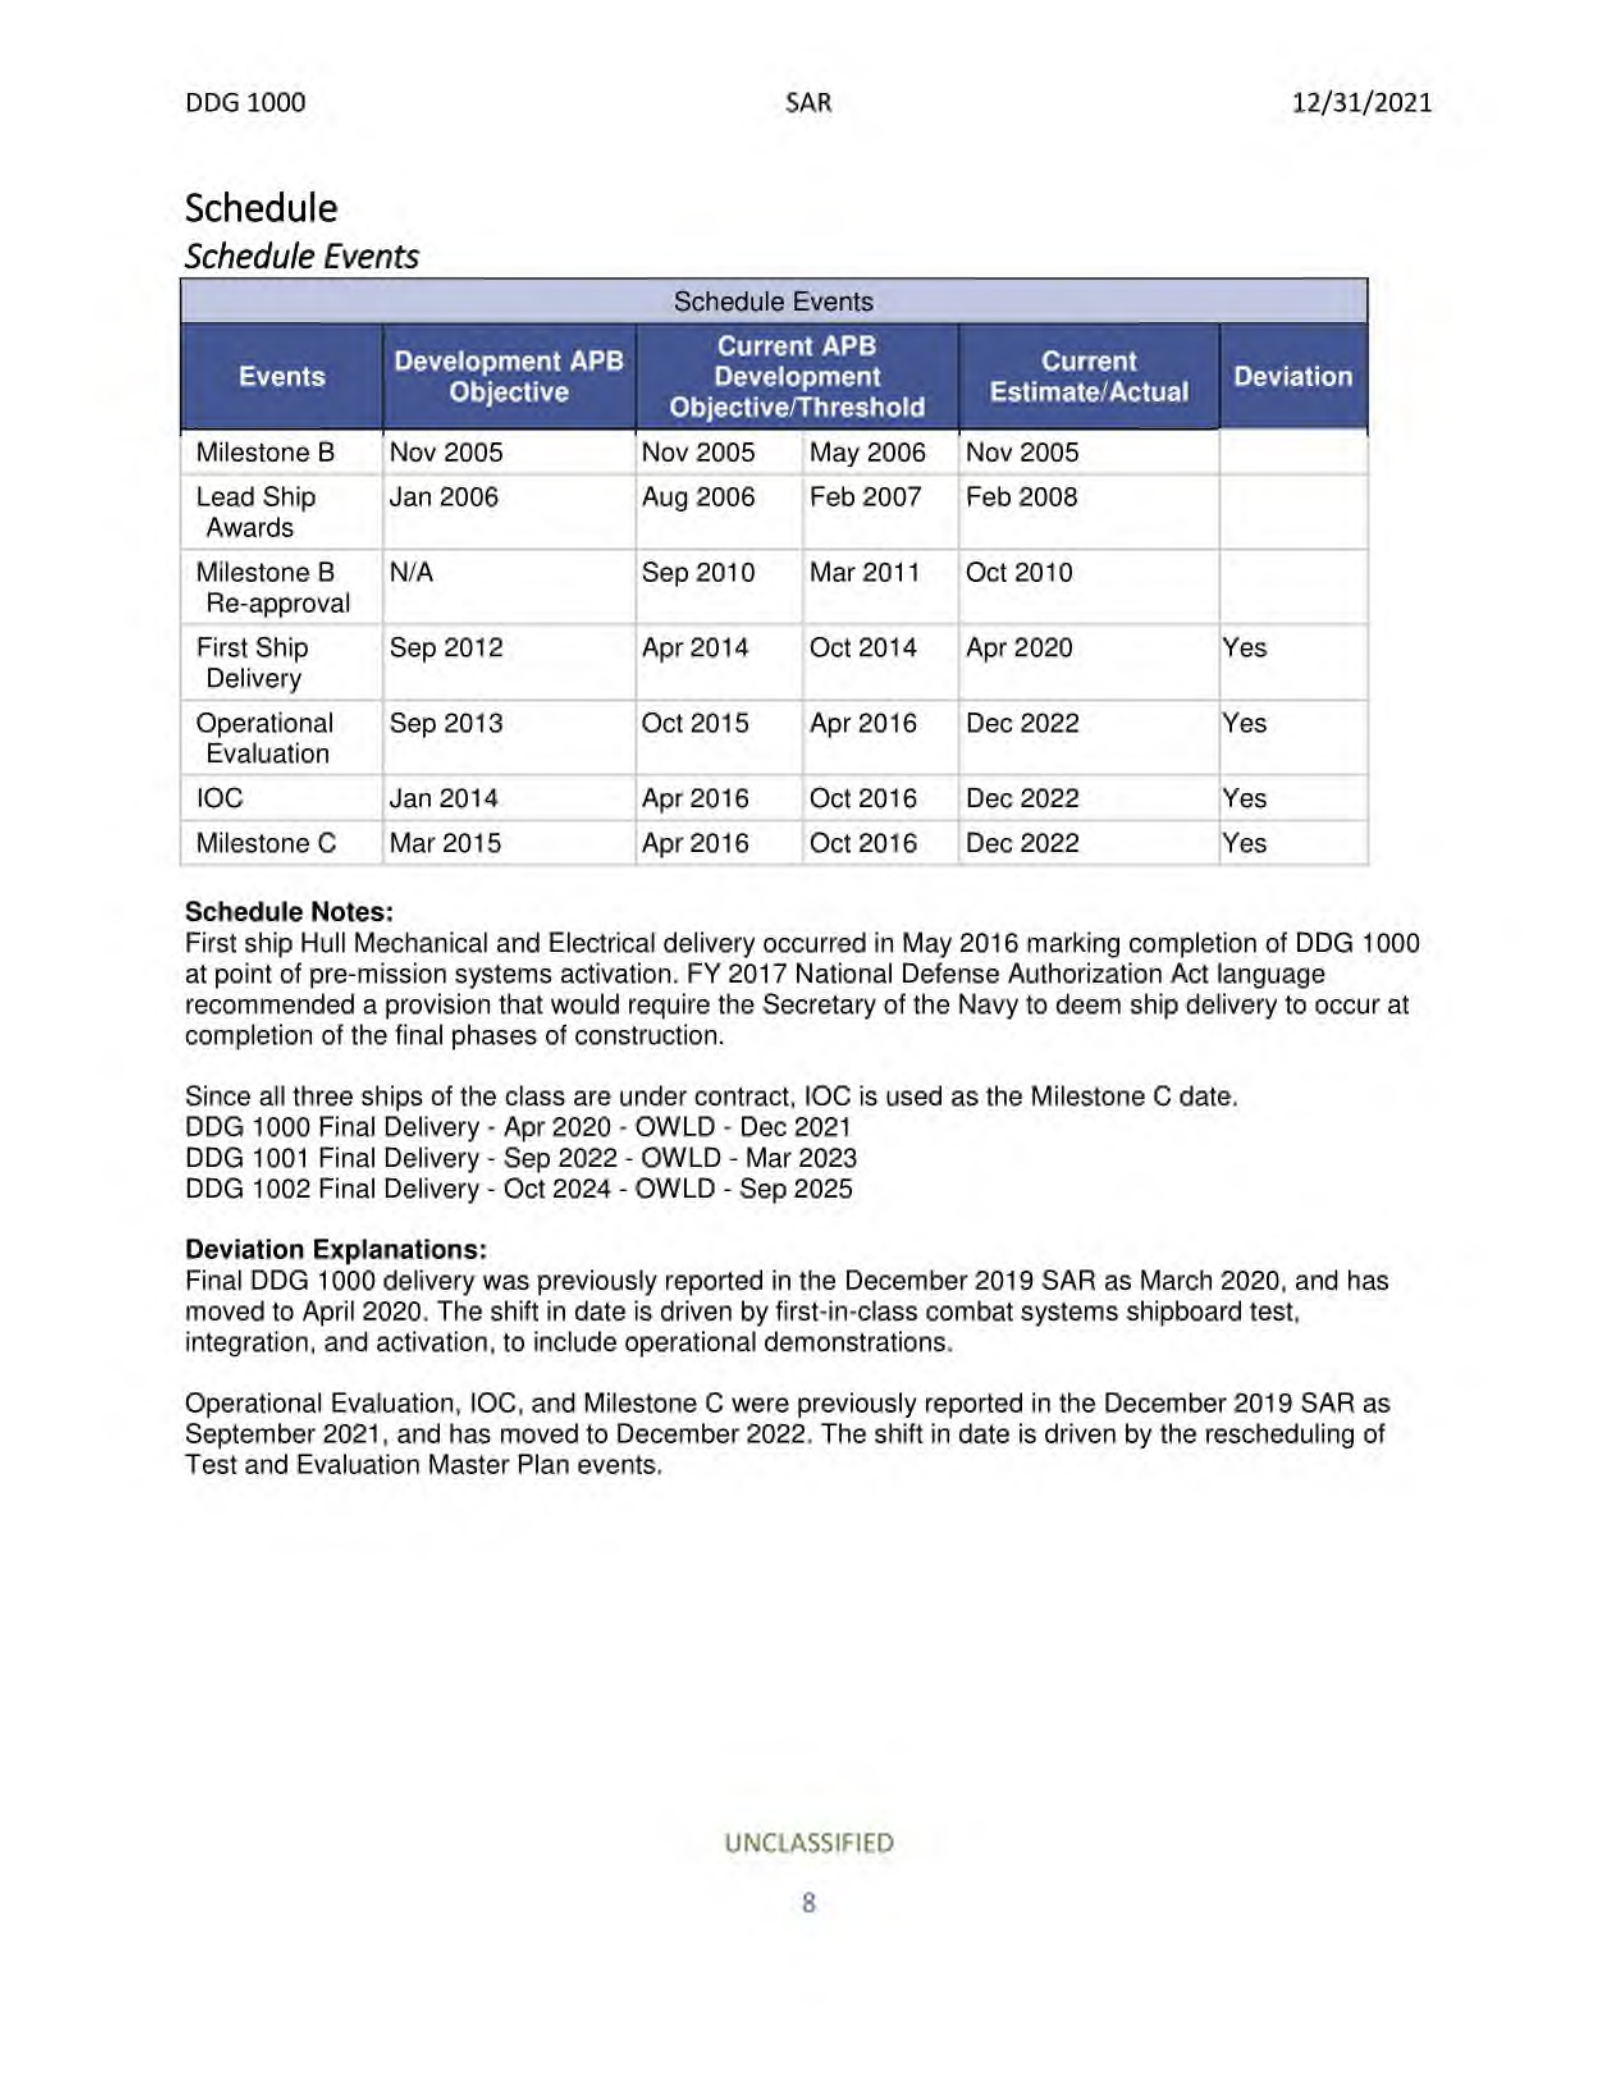
The tool did that read in one pass, and showed its work:
Process
Constraints and adaptation
We scoped the sprint around the F-35 program: upload the latest SAR, view changes in executive summary and total funding between 2017 and 2021. Two days in, the plan broke. Working through F-35 data with our subject-matter expert, we hit subprogram nesting and inconsistent SAR formatting across years — the AI couldn't reliably locate comparable funding fields. Our SME called the pivot; he had the program knowledge to see we'd spend the whole sprint fighting the data instead of proving the concept.
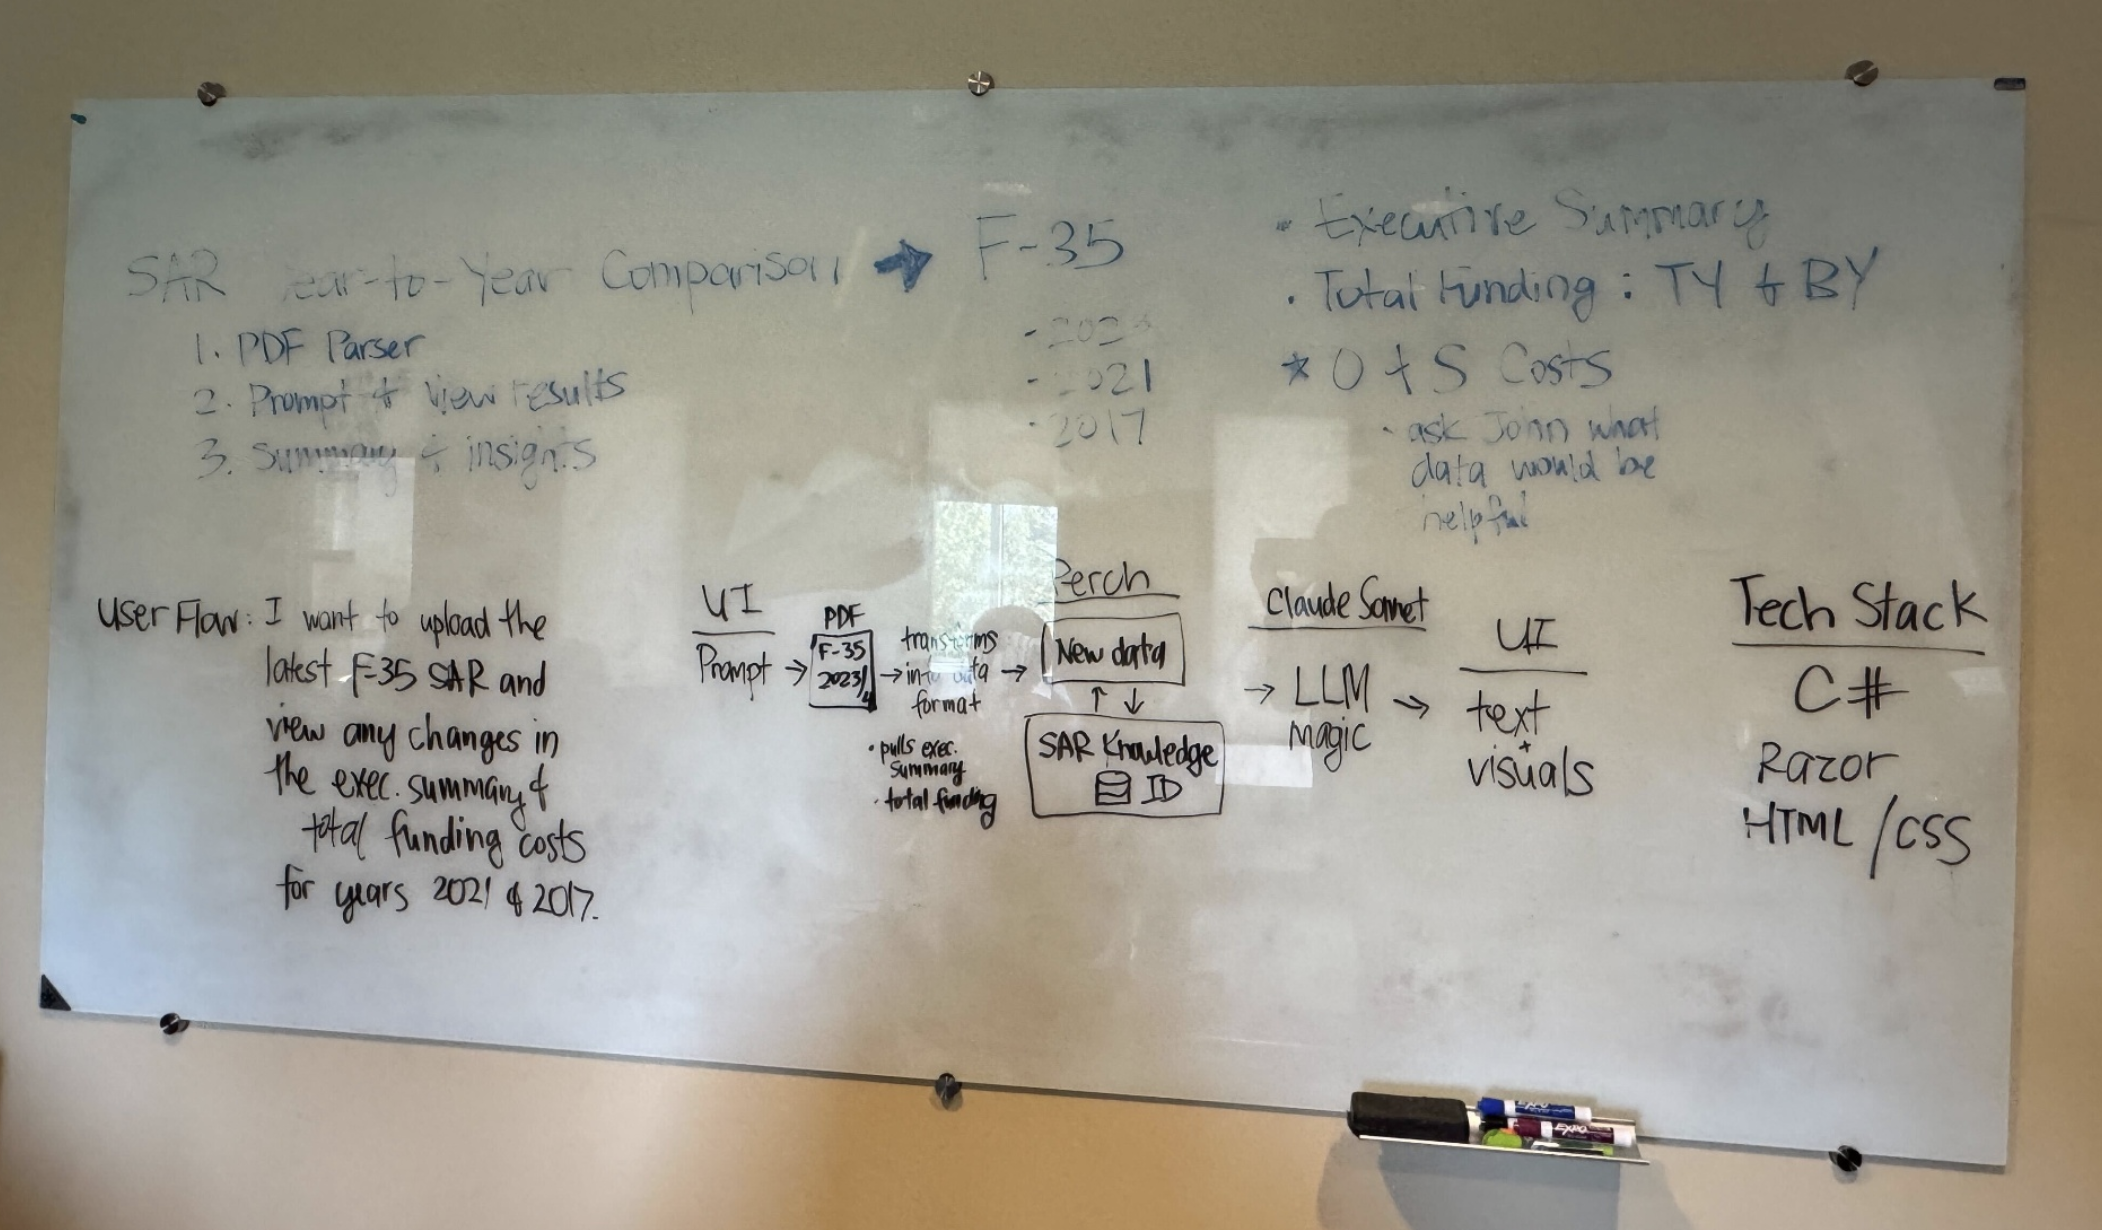
We switched to the DDG 1000 (Zumwalt-class) program — cleaner data, no subprograms, consistent structure — and moved the stack from C#/Razor to JavaScript/Node.js the same day. Two pivots in one day.
Design approach
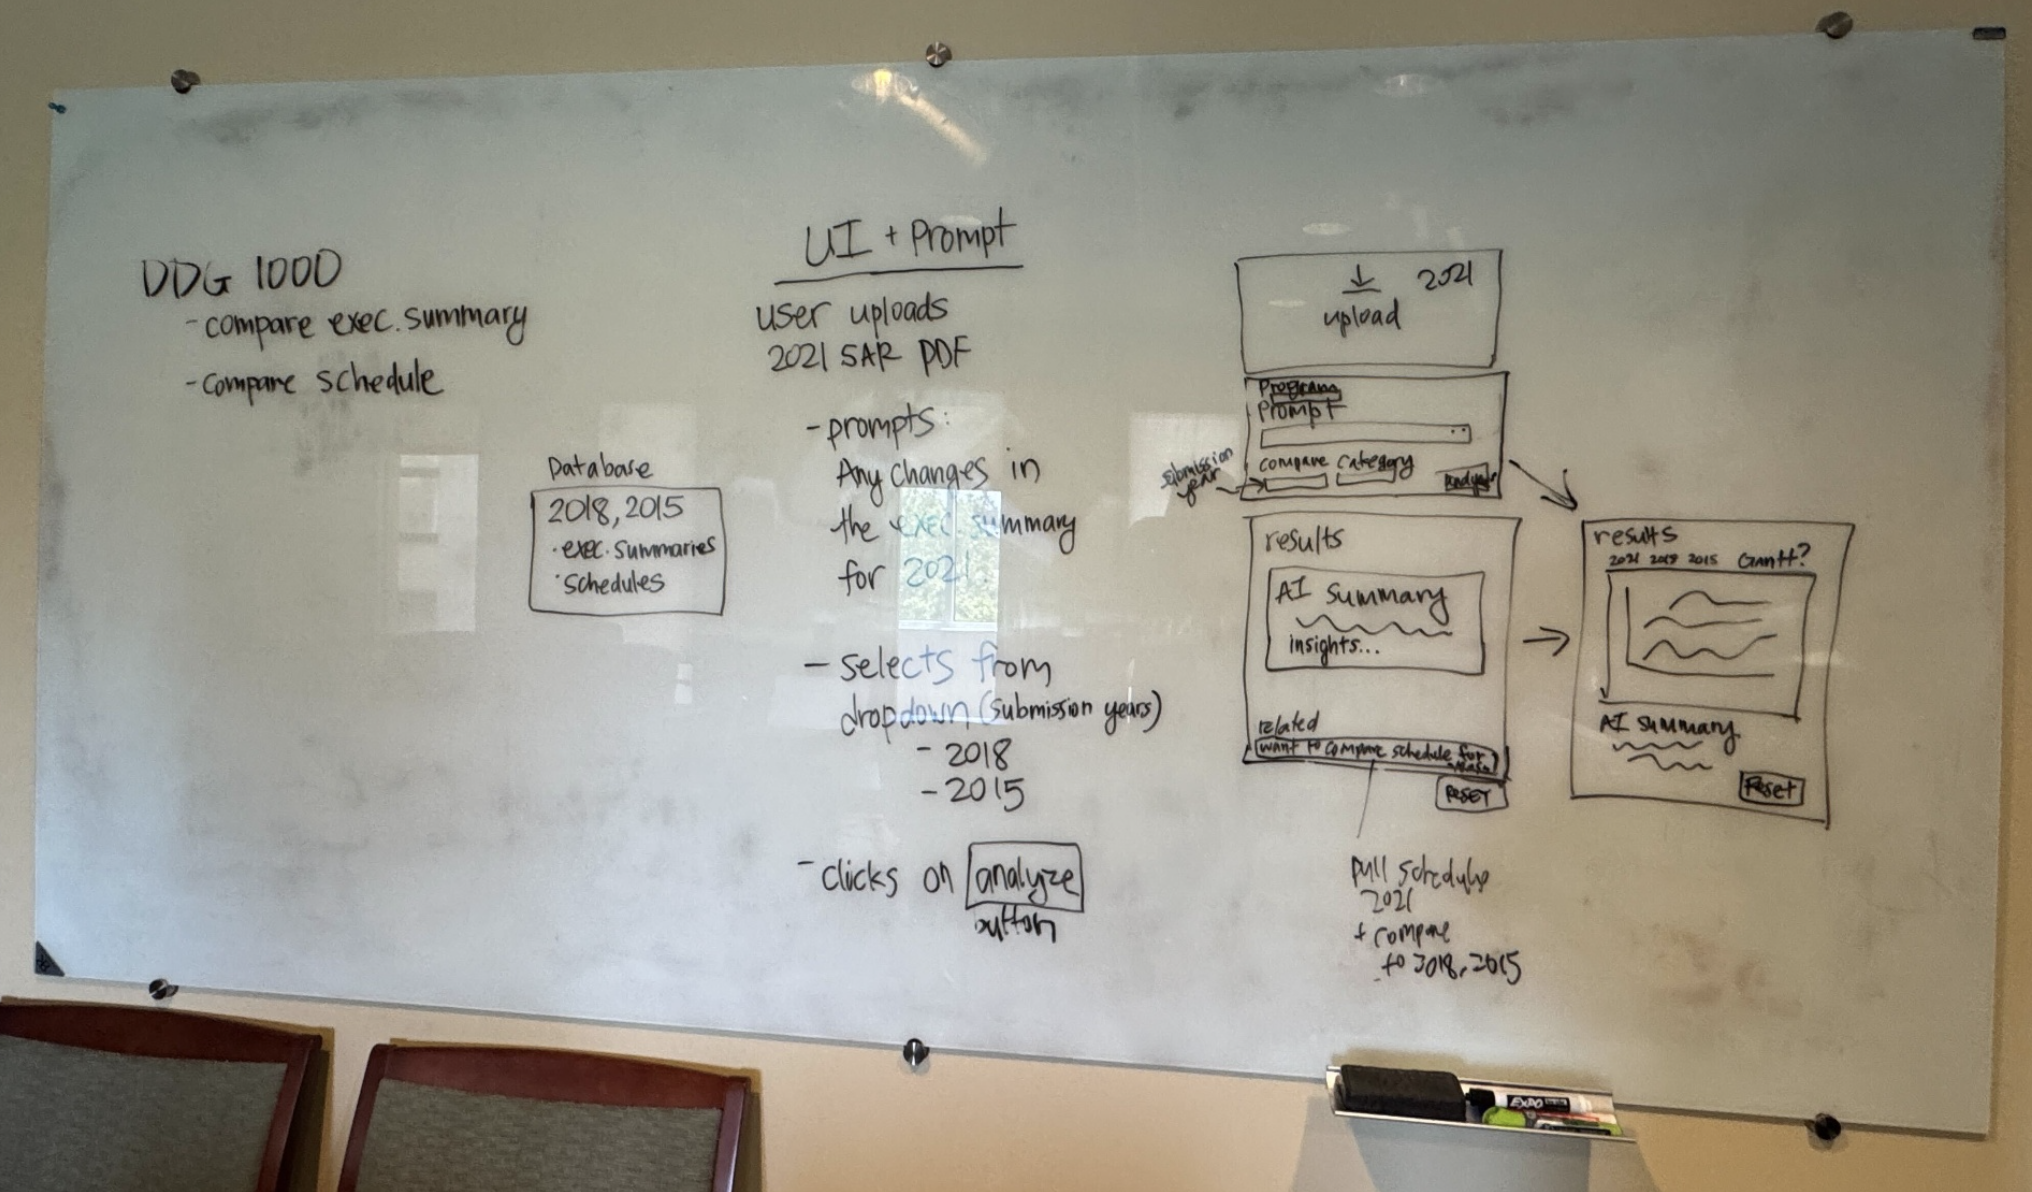
The core decision was a hybrid interface. The whiteboard version was a pure template: upload, pick years from a dropdown, click Analyze. Clean, but it forced every analyst through the same question shape. In testing I watched analysts try to ask things the template didn't cover, so I pushed for conversational entry with scaffolded guardrails:
- A free-text question field at the top
- Example chips showing the kinds of questions the tool handled well
- Optional refinement dropdowns for submission year and SAR section
Analysts asked freely; the interface taught them the tool's range without a manual.
Trust anchored before the model speaks
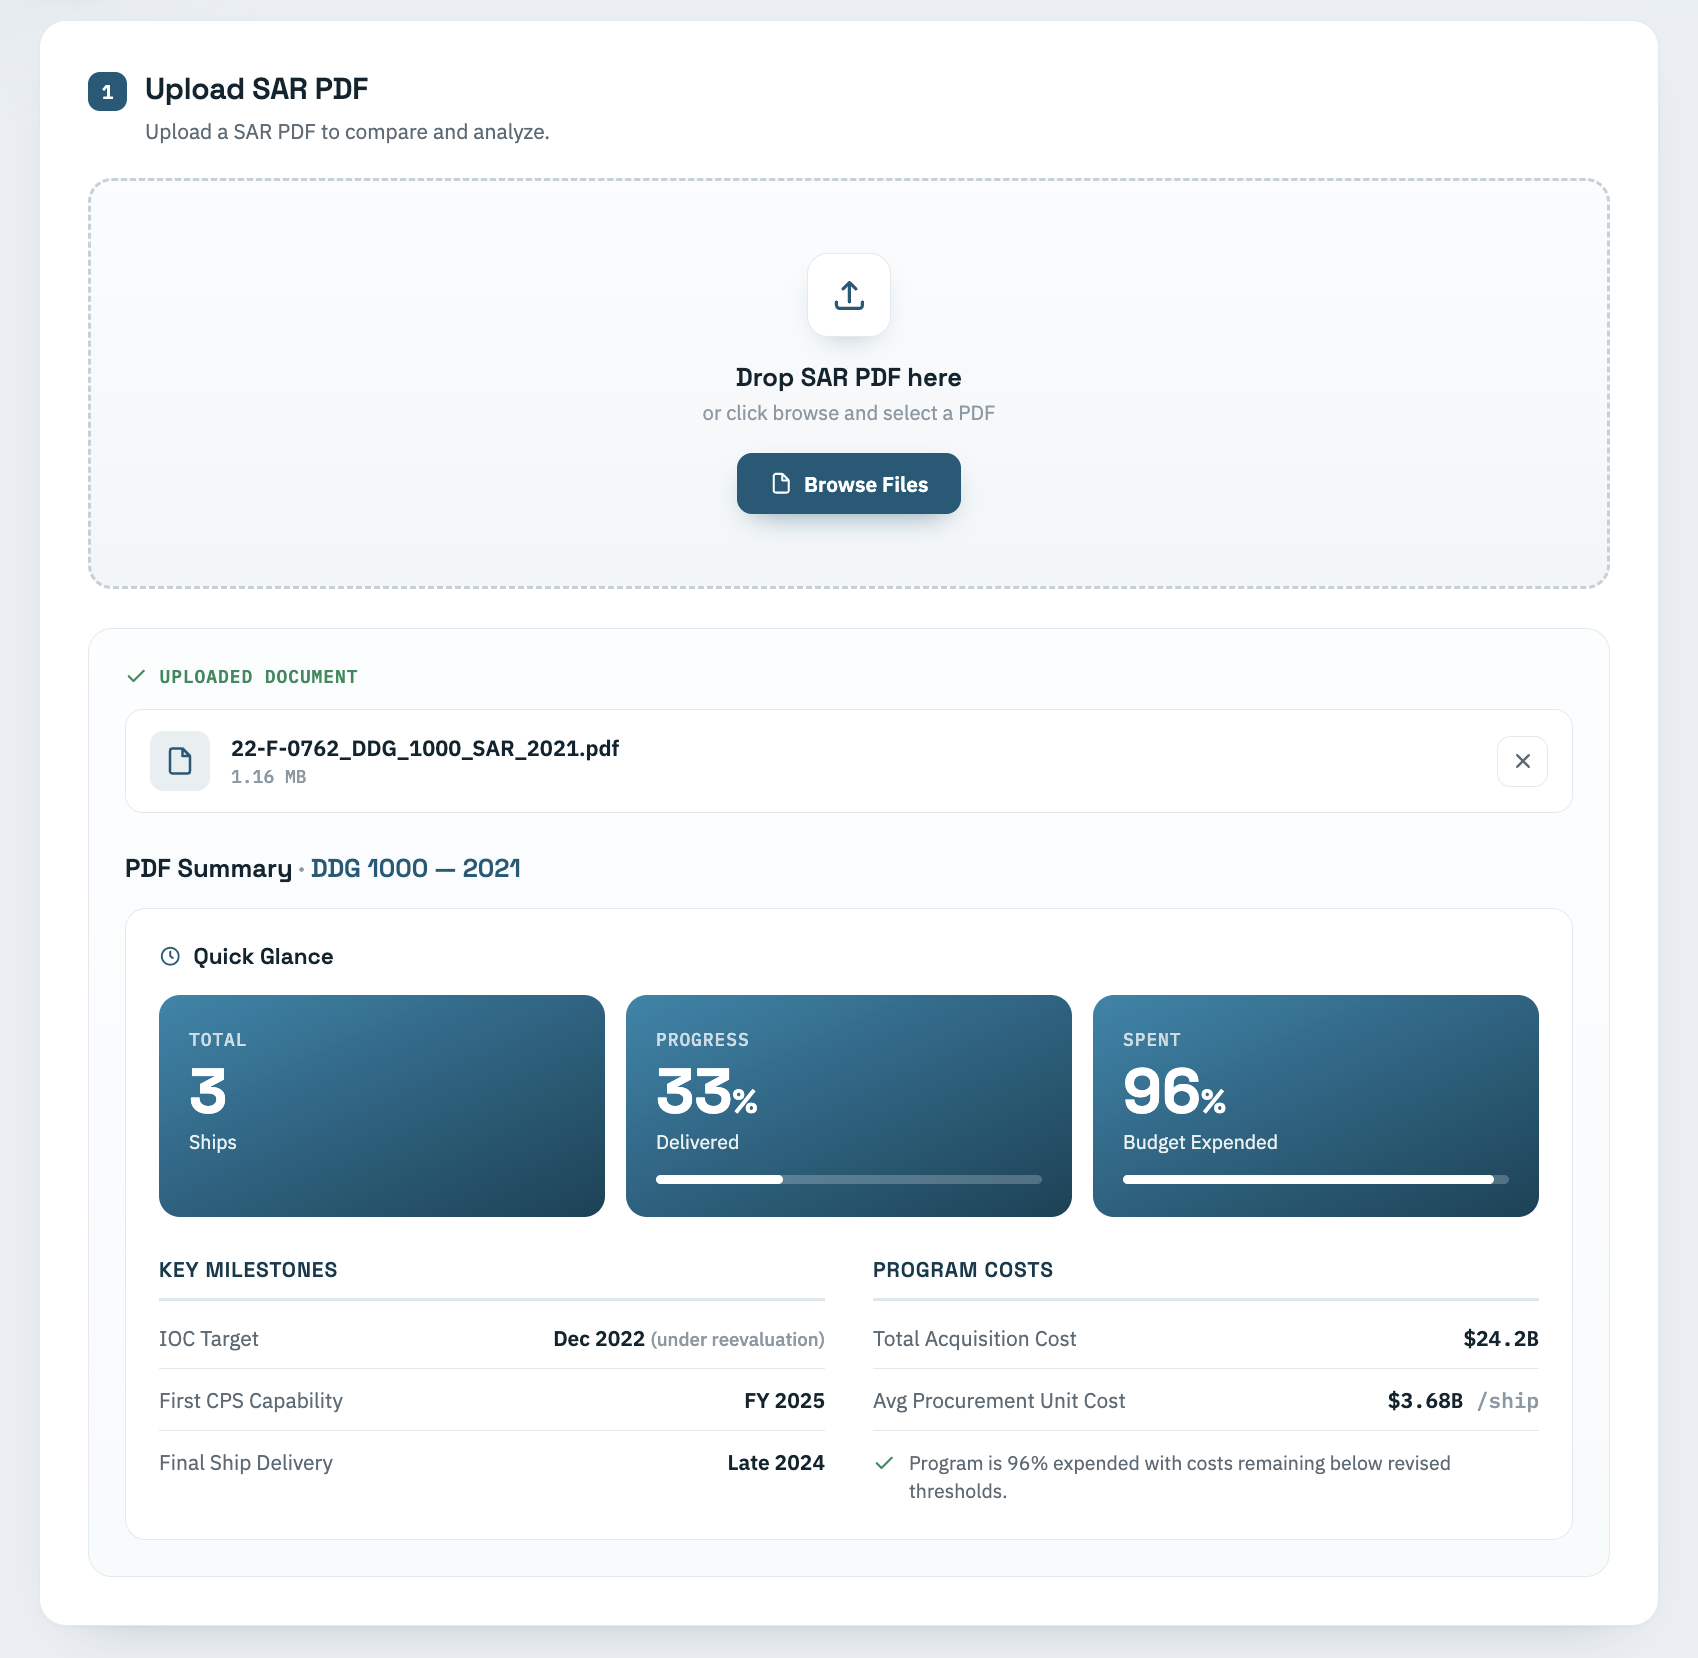
The team designed a Quick Glance panel that populates on upload — ship count, delivery percentage, budget expended, key milestones, program costs. This one wasn't my call, but in testing it did critical work: analysts had a grounded reference to sanity-check AI output against before they read a generated response. Trust started before the model spoke.
Designing around AI unreliability
Three failure modes showed up in testing, and we designed around each:
- The model reversed correct answers when challenged — so source references sit next to every response.
- It produced different output formats for identical queries — so spec-style prompts enforce consistent output.
- It referenced previously uploaded files when answering about a new one — so the active document is always explicit in the UI.
Prompt engineering: the prompt is a design artifact
The biggest shift in my thinking: I stopped treating prompts as instructions and started treating them as component specs. To get consistent output, I specified it the way I'd specify a Figma component — exact hex codes, exact layout structure, exact typography, exact semantic color rules. One schedule-analysis format prompt specified CSS variables, Chart.js configuration, responsive breakpoints, tooltip callbacks, and semantic color meanings; it ran several hundred lines, longer than most components I've designed. Once I moved to spec-style prompts, output became consistent across runs and analysts learned the visual language once, then read every result fluently.
What I learned
Trust is designed before the model speaks — in regulated domains, the pre-AI moment of the interface matters as much as the AI moment. And constraint sharpens decisions: we pivoted the program, the stack, and the interface inside five days, and every constraint forced a clearer call. Staff-level design here wasn't knowing everything; it was building the conditions where the person who did know something was heard, and moving fast when they were.
This was also enterprise data, even at 5-day sprint speed. Cost analysts on regulated acquisition programs distrust ungrounded AI output by default, the same posture any enterprise buyer brings to a new AI feature. Earning that trust in a sprint proved the pattern works. Earning it at scale requires the eval layer the sprint didn't have time to build.